Public transit use is up and the number of miles driven each year is down if you're part of the new generation that seems to be rejecting the ideals of their parents. For them, the car no longer represents free...
CityTownInfo.com sure thinks so. This infographic takes a look at the ways we can create sustainable cities, including degree and career paths for those interested in making the world a more sustainable place t...
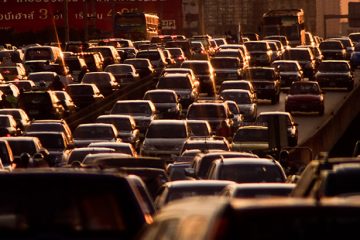
What's the cost of rush hour? Well, it turns out, a lot. Traffic jams cause over $700 in personal loses per driver per year, and the average commuter is stuck in traffic over 30 hours ever year. Ouch. This info...
Electric cars, reducing the amount of trash we produce, and creating grassroots initiatives are all part of green ways we can improve our cities. This infographic from BestSociologyProblems.com looks at 10 ways...
A big part of how well a city functions is is affordable it is for people to live there, and in order to plan policy we need to be able to see what the trends of apartment renting are. This infographic from Ren...
Is your daily commute so bad that it is actually taking years off of your life? This inographic from College@Home shows some revealing data on how the commute increases anger, increases risk of heart attack, an...
Tomorrow's urban problems will be solved in smart cities. This infographic from postscapes.com shows us what the smart city looks like, how the city works as a platform, and how the slum dwellers will better ut...
A tale of two cities. London and Paris, two of the world most famous and glamorous cities are compared in this infographic. Numerous comparisons are made including notes on architecture, population, family fun ...
With concern about personal carbon footprints growing, people are giving more thought to how they get from point A to point B. This infographic from cheapcarinsurance.net breaks down how different modes of driv...